在MATLAB中,使用一个函数errorbar来定义图形中的误差线。可以用于折线图,柱状图等各种图形。实例如下:
[cc lang=”matlab”]
% 生成示例数据
x=1:10;
y=cumsum(randn(1,10));
lower = y – (rand(1,10));
upper = y + (rand(1,10));
% 由于errorbar函数使用相对差值在图形上绘图,所以
% 需要将绝对差值转变为相对差值。
L = y – lower;
U = upper -y;
% 绘图时需要设定 hold on
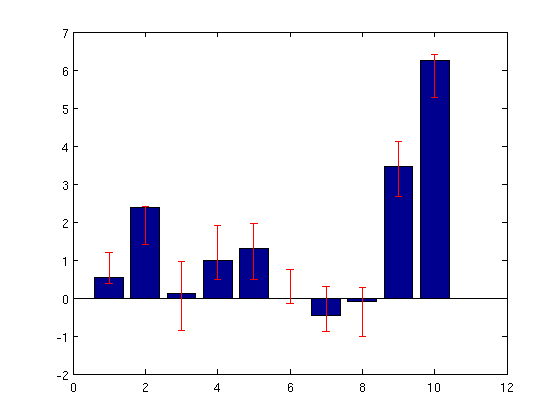
% 柱状图
clf;
figure(1);
hold on;
bar(x,y);
% 此处需要隐藏折线
errorbar(x,y,L,U,’Marker’,’none’,’LineStyle’,’none’);
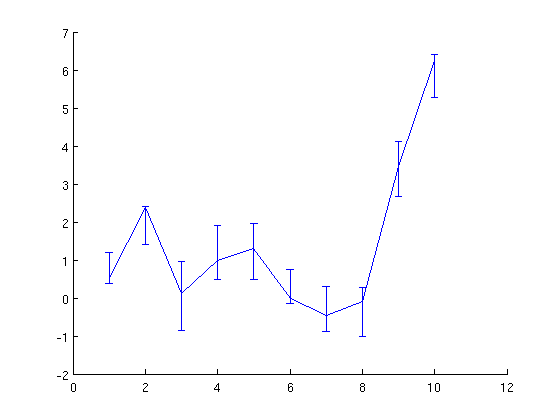
% 折线图
figure(2);
hold(‘on’);
plot( x, y);
errorbar( x, y, L, U);
[/cc]
效果如下图所示:
refer:http://stackoverflow.com/questions/3748310/how-to-define-error-bar-in-matlab