首先,看一下效果图。
默认条件下的柱状图

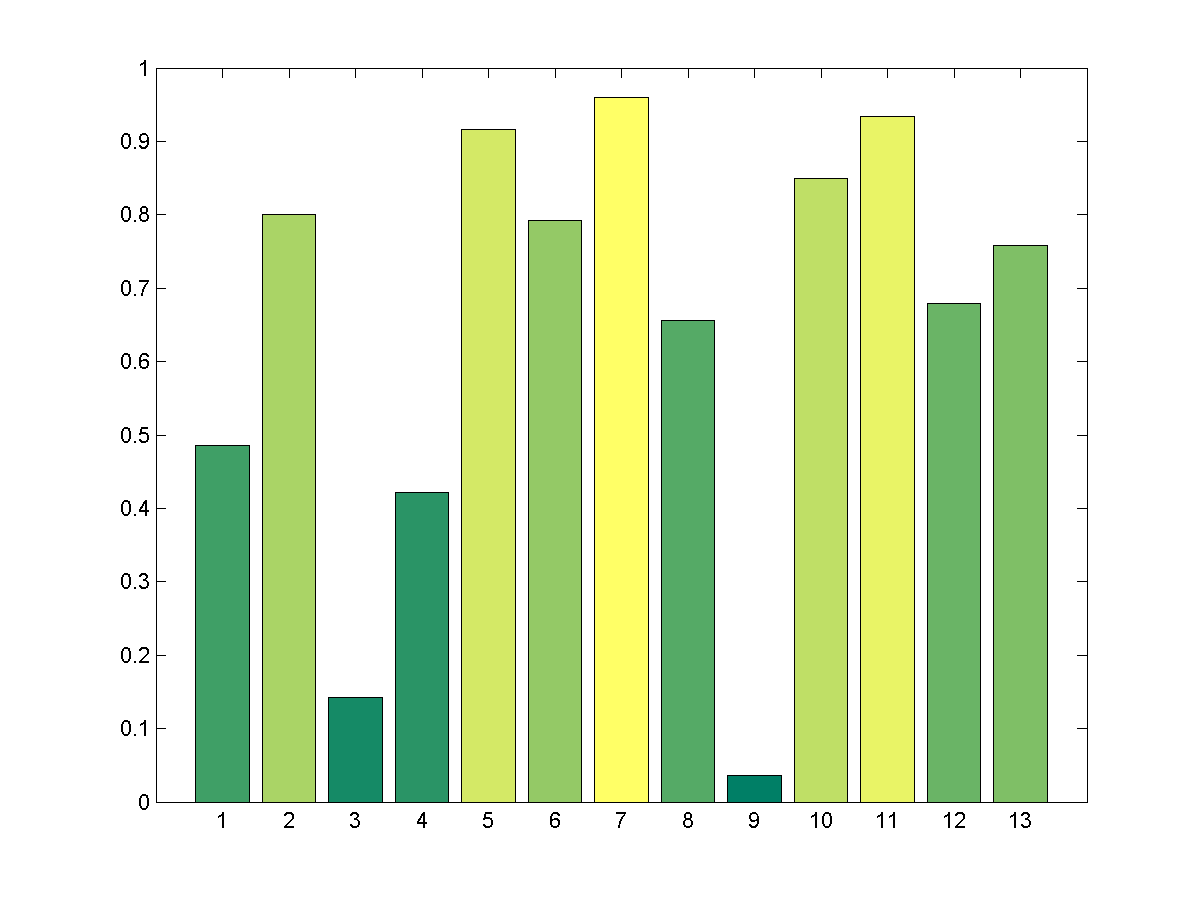
漂亮的柱状图
渐变着色的柱状图

代码如下:
[cc lang=”matlab”]
% 彩色柱状图
%% 用到的数据
n = 13;
Z = rand(n,1);
%% 默认图片
bar(Z);
%% 简单的作图
% 这个图根据数据列中值的大小着色。每列中的
% 值越大,颜色越突出
figure
h=bar(Z);
colormap(summer(n));
ch = get(h,’Children’);
fvd = get(ch,’Faces’);
fvcd = get(ch,’FaceVertexCData’);
[~, izs] = sortrows(Z,1);
for i = 1:n
row = izs(i);
fvcd(fvd(row,:)) = i;
end
set(ch,’FaceVertexCData’,fvcd)
%% 更加漂亮的图片
% 图片会以渐变的方式着色,效果非常不错
figure
h=bar(Z);
ch = get(h,’Children’);
fvd = get(ch,’Faces’);
fvcd = get(ch,’FaceVertexCData’);
[zs, izs] = sortrows(Z,1);
k = 128; % 准备生成128 *3 行的colormap
colormap(summer(k)); % 这样会产生一个128 * 3的矩阵,分别代表[R G
B]的值
% 检视数据
whos ch fvd fvcd zs izs
%
% Name Size Bytes Class Attributes
%
% ch 1×1 8 double
% fvcd 66×1 528 double
% fvd 13×4 416 double
% izs 13×1 104 double
% zs 13×1 104 double
%
shading interp % Needed to graduate colors
for i = 1:n
color = floor(k*i/n); % 这里用取整函数获得color在colormap中行
row = izs(i); % Look up actual row # in data
fvcd(fvd(row,1)) = 1; % Color base vertices 1st index
fvcd(fvd(row,4)) = 1;
fvcd(fvd(row,2)) = color; % Assign top vertices color
fvcd(fvd(row,3)) = color;
end
set(ch,’FaceVertexCData’, fvcd); % Apply the vertex coloring
set(ch,’EdgeColor’,’k’)
[/cc]