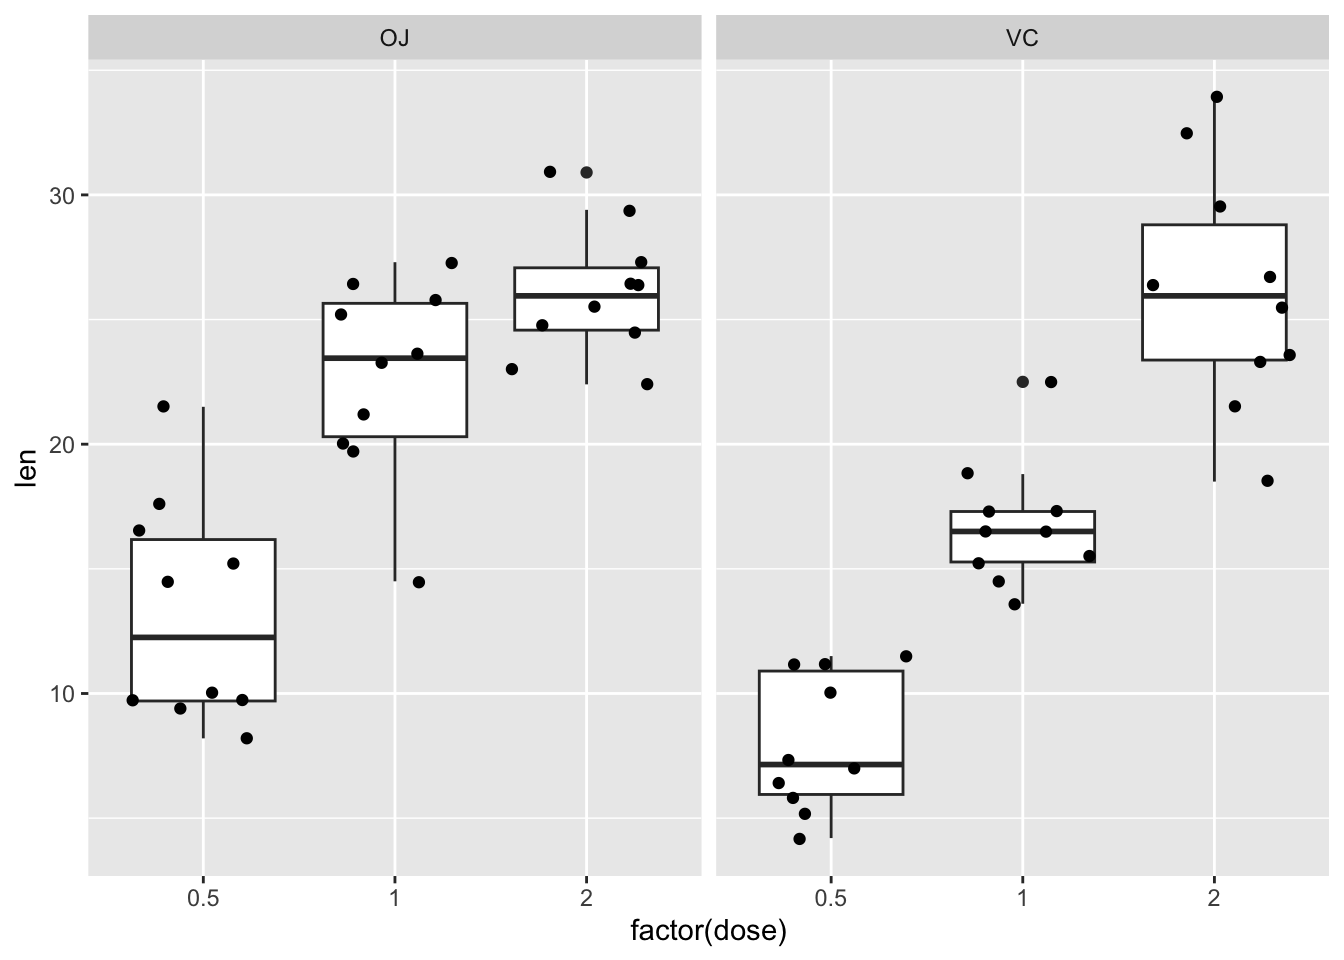
先载入一个示例数据。该数据是研究摄入 VC 对小鼠牙齿生长作用的实验结果。VC 给药分成两种方式:VC-给予VC药片;OJ-给予相当量的橙汁。给药的量都包括0.5,1,2等三个梯度。
从散点图上看,不同给药量之间应该有显著差异。
data("ToothGrowth")
head(ToothGrowth)
##    len supp dose
## 1  4.2   VC  0.5
## 2 11.5   VC  0.5
## 3  7.3   VC  0.5
## 4  5.8   VC  0.5
## 5  6.4   VC  0.5
## 6 10.0   VC  0.5
dim(ToothGrowth)
## [1] 60 3
library(ggplot2)
ggplot(ToothGrowth,aes(factor(dose),len)) +
  geom_boxplot(outlier.shape = NULL) +
  geom_jitter() +
  facet_wrap(~supp)
单因素方差分析使用 aov() 函数,随后,进一步使用 HSD.test 获取组间差异。 Tukey’s ‘Honest Significant Difference’ method 通常使用 stats::TukeyHSD() 函数, 但在这里,我们使用 HSD.test() 可以得到分组信息,用于后面的作图。
这里仅以 VC 给药方式下,不同给药量之间的差异分析为例。
library(dplyr)
##
## Attaching package: 'dplyr'
## The following objects are masked from 'package:stats':
##
##     filter, lag
## The following objects are masked from 'package:base':
##
##     intersect, setdiff, setequal, union
library(agricolae)
data <- filter(ToothGrowth,supp=="VC")
model <- aov(len~dose, data = data)
group <- HSD.test(model,"dose",group = T)$groups
group_label <- data.frame(dose=rownames(group),group=group$groups,stringsAsFactors = F)
group_label <- data %>% group_by(dose) %>%
  summarise(label_y = quantile(len)[[5]]) %>%
  mutate(dose = as.character(dose)) %>%
  left_join(group_label)
## Joining with `by = join_by(dose)`
dose_level <- sort(as.numeric(unique(as.character(data$dose))))
data$dose <- factor(data$dose, levels = c(0.5,1,2))
group_label$dose <- factor(group_label$dose, levels = c(0.5,1,2))

ggplot(data,aes(dose,len)) + geom_boxplot() +
  geom_text(mapping = aes(dose,label_y,label=group),vjust=-0.5,data = group_label) +
  # 增加 ymax 的数值
  ylim(min(data$len),max(data$len)+0.1*(max(data$len)-min(data$len))) +
  theme_bw()
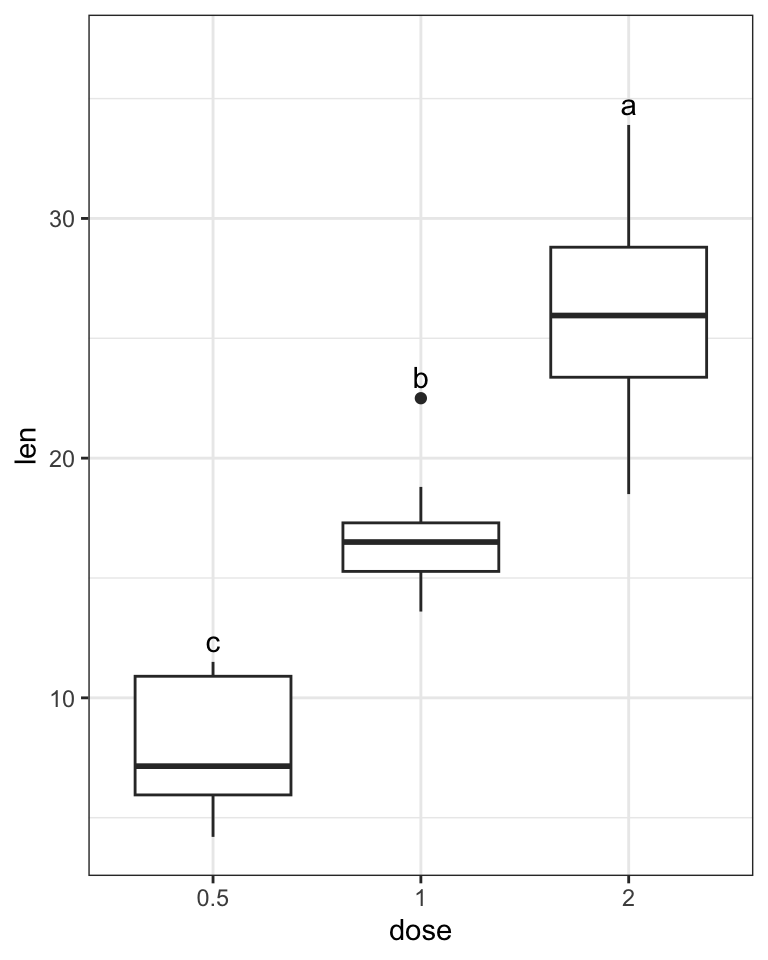
此处仅有3个不同处理。从图中可以得知,0.5,1,2分属3个不同的分组,这意味着它们两两之间都存在显著的差异(p.adj < 0.05)。
这种分析作图方式在 ANOVA 处理特别多的处理时会更好用。